![Image]()
Res Ipsa wrote: ↑Fri Nov 13, 2020 1:12 am
Before I spend any time on your list, Subs, how much time have you spent verifying that these are real statistical anomalies. Or are you taking some guy on the internet at face value?
This is why I rarely bother to respond to your wild, fact-free claims. You just copy crap off the internet without spending even minimal effort to do any sort of fact checking:
Taking your "proven statistical anomalies" in order:
Turnout in Milwaukee was way, way above historical norms.
In 2016, statewide turnout in Wisconsin was 67.34 percent.
In 2020, voting wards all over the city were reporting turnout levels greater than 80 percent.
Of the city’s 327 voting wards, 90 reported turnout of greater than 90 percent; 201 reported turnout higher than 80 percent.
In 2016, city voter turnout was 75 percent.
nearby city of similar demographic (Cleveland) was no where near such deviations.
This isn't a "proven statistical anomaly" -- its bad math. There were bunch of claims that Wisconsin's turnout was an anomaly. But there was not anomaly. Wisconsin has same day voter registration. When it reports past voter turnout percentages, it includes people who registered same day. The geniuses that pushed this conspiracy theory didn't include the same-day registration totals for the 2020 election. The "geniuses" included Uday and Kusay.
https://www.usatoday.com/story/news/fac ... 176028002/
In fact, the total votes cast in Milwaukee in 2020 was about the same as in 2016, despite record turnout in the state.
https://www.jsonline.com/story/news/pol ... 188097002/ So, no proven statistical anomaly. In fact, using Sub's logic, the fact that Milwaukee's vote total is out of line with the rest of the state "proves" election fraud by Republicans.
Both of these articles were in the first few entries of a google search.
This was proven NOT to be a statistical anomaly six days ago. Sub posted anyway.
Strike One.
Your beloved 538 tweeted:
"Two more batches of Pennsylvania vote were reported:
-23,277 votes in Philadelphia, all for Biden
-about 5,300 votes in Luzerne County, nearly 4,000 of which were for Biden" (emphasis mine)
23k votes appear and not a single vote for "not-Biden"?
This was proven NOT to be a statistical anomaly on election night, over a week ago. I know, because I was reading the 538 live blog. They also posted a followup as the first response to the tweet itself:
https://Twitter.com/FiveThirtyEight/sta ... 76/photo/1
If you're not into clicking, sometimes election desks update candidate totals separately instead of together. Trump's corresponding totals were included in the next update, where his percentage was anomalously high.
Easily found by googling "fivethirtyeight 23,277" Proven NOT to be an anomaly over a week ago. Sub posted it anyway.
Strike Two.
Likewise, peculiar trends on the absence of down-ticket voting that dramatically diverge from historical trends...yet only in areas that were critical to the election (a.k.a. not widespread through nation). Too many numbers for here, but I assume you can google.
No evidence. No source. Ball one.
Mail in votes have a rejection rate of at least 2% even in well run elections - The rejection rate for this election is 0.1%
No evidence. No source. Also false.
The rejection rate for the 2016 election was less than 1% and the rate in 2018 was 1.4%.
https://abcnews.go.com/Politics/750000- ... d=73645323 We've had an all mail ballot system in Washington since the mid 2000s, and our rejection rate has always been 1.1-1.2%. The 2% figure is pure BS.
But what about 2020? Was the rate really 0.1%? Sub gives no source, and the only ones I've found were estimates taken during the count. The only official figure I could locate was Kentucky, with a rejection rate of .4%.
https://www.courier-journal.com/story/n ... 161749002/ Hmm, maybe this is more statistical proof that Republicans are cheating.
If you use the Google, what you'll find is that, after some high rejection rates in the primaries, states undertook education campaigns, enacted "cure" processes, and redesigned instructions to reduce confusion. Many states published lists of rejected ballots online, and the campaigns were aggressive in contacting those voters and urging them to take the steps needed to correct whatever error was made. So, there isn't really a benchmark to compare this election to because of the unique circumstances.
Strike 3.
But I'll give Sub one last pitch:
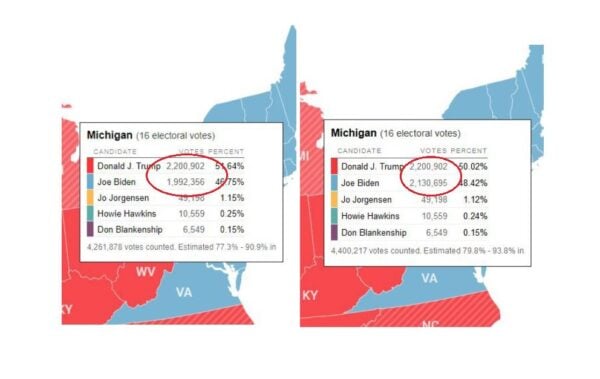
This is a partial image of a tweet sent out on election night. It was proven NOT to be a statistical anomaly within hours.
https://www.factcheck.org/2020/11/cleri ... n-results/
The GOP operative that originally tweeted the image acknowledged that this was a simple clerical error and deleted the original tweet. He did that eight days ago, but Sub still posted it tonight.
Strike 4.
I glanced through the other links. It's more of the same, only involving more mathturbation. Not worth my time.
None of what Sub posted is a "proven statistical anomaly." Any lawyer who tried to introduce them in court would be risking Rule 11 sanctions.