Droopy's Myths Debunked

The Off-Topic forum for anything non-LDS related, such as sports or politics. Rated PG through PG-13.
_Kishkumen
_Emeritus
Posts: 21373
Joined: Sat Dec 13, 2008 10:00 pm

Re: Droopy's Myths Debunked

Post by _Kishkumen »

Droopy wrote:When any leftist like Kishkumen begins talking about "consensus" within "the scholarship" but fails to make an logical, substantive argument regarding the actual principles involved, you have prima facie evidence that this person has come to the discussion already running on fumes.


Droopy, I am merely informing you of the facts, and the facts are that the majority of tax scholars think that the mystical powers attributed to the Laffer Curve by conservatives are laughable. Because, in fact, a tax cut's boost to the economy is fairly limited. If you don't like the facts, then you are clearly just an ideologue with an agenda.

What is it that I exactly need to argue, when what I am doing is telling you what I know about the consensus of tax academics? I will say that the statistics appear to bear out their argument, whether you like it or not. Too bad for you, Droopy.
"Petition wasn’t meant to start a witch hunt as I’ve said 6000 times." ~ Hanna Seariac, LDS apologist
_Kevin Graham
_Emeritus
Posts: 13037
Joined: Fri Oct 27, 2006 6:44 pm

Re: Droopy's Myths Debunked

Post by _Kevin Graham »

Nothing I could post is anything much different than the stuff I've been posting for years in this forum. But why bother since, no matter the prestige or scholarly reputation of my sources, so long as it's "right wing" you will dismiss it out of hand.

Actually you're just projecting here. The record shows that no matter how prestigious my sources are, you'll just dismiss them as Leftists. I'm still waiting for you to back up your numerous idiotic comments, but you're unable, obviously.
Since you clearly cannot argue your case rationally from principle and coherent theory, please continue to post graphs and charts.

I responded to your idiotic assertions with graphs based on indisputable data. If you think it is disputable, then dispute it. Show us why the graph provided by your own Think Tank is in error. Now you claimed you could provide graphs contradicting the data I presented and I think we all know by now you were just bluffing. Now that you realize the data is indisputable, you want to complain because I presented them with visuals a child could understand.
As I said, for evey one you post, I can post one debunking it. I've been doing that since this board came on line, and its all been seen before.


THEN DO IT.

You're bluffing and you know it. If you could, you would have already. The myths I debunked on this thread you cannot support with anything. Nothing.
Indeed, the long essay by Art Laffer I linked to contains a number of statistical charts demonstrating quite clearly the known effects of specific kinds of tax cuts on government revenue, as well as other indicators, going all the way back to the 20s.

You do not understand Art Laffer, which is what makes your argument so damn hilarious. I already proved in the other thread that you do not read or comprehend the articles to which you link. The Laugher curve never said revenues go up every time taxes go down. He never said that. There have only been a handful of morons on this planet to misinterpret his theory to mean that. George Bush, a few Republican politicians, the Right Wing talk radio hosts, FOX News journalists and then the internet morons who just relay the same scripted talking points based on an erroneous understand of the theory.
But beyond this, I'd like to see you refute the conservative/libertarian position on principle

It has already been refuted. The notion that Federal Revenues go up whenever taxes are decreased flies in the face of US Tax History. Just recently we found out that the Bush Tax cuts resulted in a decrease in revenue. The Clinton increase resulted in an increase in revenue. Case closed. What happened during the Reagan years was an anomaly that had more to do with drastic cuts in interest rates than it did tax cuts. And I already proved that Reagan actually increased taxes on a number of occasions, but you have no response to that because you haven't yet found a mises/heritage article that pretends to address this problem. Conservative Reagan economists even admitted interest rate cuts is what created the economic boom, and yet you have no response other than to say, "you're wrong and I'm right."
I'd like to see you provide a compelling argument, based in sound economic reasoning and logic, why higher tax rates, which discourage/depress private sector economic activity, produce more government revenue, and, conversely, why lower taxes on savings, risk, and investment, which increases economic activity, would not broaden the tax base and bring in higher tax revenues as businesses become more profitable, employment increases, and the general economy grows.

Anyone who has been living on planet earth during the last decade already knows what a beating this so-called "Conservative/Libertarian principle" has taken. The majority of economists have shifted drastically to the left, which is why you're still relying on outdated economic rants from people who have been dead since nearly two decades. Even Alan Greenspan admitted that his entire economic view shattered in recent years. Only the minoritry die-hards - whose paychecks come from Right Wing think tanks, who no longer do research but merely serve as the credentialed voices for the Right Wing - have a vested interest in burying their heads in the sand all this time while still trumpeting failed economic theory.
Laffer has already shown, in the essay I linked to, empirical data demonstrating that, in every case in which these most salient taxes are lowered or raised, government revenue is effected as private sector behavior is modified by the type and severity of taxes imposed.

You obviously haven't read this article either. From the article we read,"The Laffer Curve itself does not say whether a tax cut will raise or lower revenues." Contrast this to your idiotic claim that lower taxes always result in higher federal revenues. And to reiterate the point, this is precisely what you said: "The higher marginal tax rates go, the less government revenue is generated, and the lower tax rates go, the more revenue flows to the treasury." Your only evidence? A link to Art Laffer's curve.

Last year Alan Reynolds from CATO wrote an article expressing frustration that so many morons on the Right misrepresent Laffer in this way. He said: "No economist ever claimed that all taxes are so distortionary that increasing any tax rate would reduce revenue. Art Laffer never said that."

But you'll continue to link articles pretending they support your stupidity.

The comment denying your assertion came right after Laffer's graph. What Laffer's theory suggests is that revenues increase from tax cuts only when existing taxes are in the "prohibitive range." But if they are below that "prohibitive range," then revenues decrease. Well, duh. This amounts to saying it can go either way, depending on a multiplicity of economic factors at the time. And Laffer doesn't tell us what the range really is because it all depends on the economic climate at the time. So what percentage is the prohibitive range? Laffer doesn't say. He just draws us a pretty graph placing a dot right smack dab in the middle, between 0% and 100%.
How many sources would you like? How many dozen? How many score? Would you like a number of book references too

To outweigh the majority of economists who reject your argument? Let's start small, with just one reference. I bet you cannot provide a single economist who says what you just said. Not one. Alan Reynolds is confident none exist, and so am I.
_Kishkumen
_Emeritus
Posts: 21373
Joined: Sat Dec 13, 2008 10:00 pm

Re: Droopy's Myths Debunked

Post by _Kishkumen »

I am satisfied that it has been demonstrated that Droopy does not know what he is talking about in this matter. Thanks Droopy! But thanks more to Kevin.
"Petition wasn’t meant to start a witch hunt as I’ve said 6000 times." ~ Hanna Seariac, LDS apologist
_Kevin Graham
_Emeritus
Posts: 13037
Joined: Fri Oct 27, 2006 6:44 pm

Re: Droopy's Myths Debunked

Post by _Kevin Graham »

Let the record show that Droopy has yet to produce a single reference that supports his assertion. Might as well pour more salt on his wounds....

Laffer talks about the Harding-Coolidge cuts of the mid-1920s as evidence that lower taxes can result in stronger economy, but the question is whether tax increases produce higher federal revenues. He doesn't even address the fact that in 1862 income taxes were imposed and raised to help fund the Civil War, which they did successfully. Nor does he address the 1916-1917 income tax hikes and their positive effects on federal revenues. Another revenue act was passed in 1918, which hiked tax rates once again, "this time raising the bottom rate to 6 percent and the top rate to 77 percent. These changes increased revenue from $761 million in 1916 to $3.6 billion in 1918, which represented about 25 percent of Gross Domestic Product (GDP). "

How does droopy respond to this? By not responding. He can't respond to any particular facts, all he can do is throw up more hyperlinks to articles that never argue what he wants them to argue.

Moreover, Laffer doesn't address the 1932 Tax Act which increased revenues dramatically as well. Nor does he address the Reagan tax increases in his charts. He only refers to a 1981 tax cut running parallel with improved economic factors, but he doesn't include the tax increases imposed by Reagan. What I found particularly funny was the way he manipulated the economic climate during the sixties to laud the Kennedy tax cuts as evidence that revenues shot upwards: "In the four years following the tax cut, federal government income tax revenue increased by 8.6 percent annually and total government income tax revenue increased by 9.0 percent annually."

Ok, but how does this compare to the previous economic periods? If you go to this website you will be able to pull up all the data on federal revenues throughout US history. Total federal revenues did go up at 11% for 66 and 67, but that increase dropped to 5% in 68 before jumping to 17% in 69. It then took a nosedive to 7% in 1970 and then 1% in 1971. So how does Droopy explain the 15% increase in federal revenues in 1960, when the tax rates were 90% of the highest bracket?

What's more, during the Carter Administration federal revenues grew at a rate of 11-15% between 1976-1981. This is pretty impressive considering the Reagan tax cuts saw a substantial drop in rate increase. In 1982 that rate of increase was 6% and in 1983, it dropped further to 3%. Between 1984-1990 the rate of increase averaged around 6-7%, which is about half that of the Carter administration.

Anyway, it should be clear that all of this flies in the face of Droopy's idiotic claim that lower taxes always mean higher revenues. This is patently false and no economist worth his salt would ever agree to this, including Art Laffer.
_Kevin Graham
_Emeritus
Posts: 13037
Joined: Fri Oct 27, 2006 6:44 pm

Re: Droopy's Myths Debunked

Post by _Kevin Graham »

The following comes from the Right Wing paper, the Wall Street Journal:

Bush On Jobs: The Worst Track Record On Record

President George W. Bush entered office in 2001 just as a recession was starting, and is preparing to leave in the middle of a long one. That’s almost 22 months of recession during his 96 months in office.

His job-creation record won’t look much better. The Bush administration created about three million jobs (net) over its eight years, a fraction of the 23 million jobs created under President Bill Clinton’s administration and only slightly better than President George H.W. Bush did in his four years in office.

Here’s a look at job creation under each president since the Labor Department started keeping payroll records in 1939. The counts are based on total payrolls between the start of the month the president took office (using the final payroll count for the end of the prior December) and his final December in office.

Because the size of the economy and labor force varies, we also calculate in percentage terms how much the total payroll count expanded under each president. The current President Bush, once taking account how long he’s been in office, shows the worst track record for job creation since the government began keeping records. –Sudeep Reddy


Now contrast this with Droopy's claim that Bush "vitalized the economy" by "creating jobs." I mean it takes a true loon to look at the data and conclude Bush did us a favor by creating jobs!

The fact is the Bush tax cuts were designed to do only one thing, and that was to reward the wealthy constituents who put him into office. Such is the way with most Right Wing politicians. They only get away with it by convincing idiots that the tax cuts for the wealthy are always in our best interest.

Image

Image
Last edited by YahooSeeker [Bot] on Mon Dec 20, 2010 3:43 am, edited 1 time in total.
_Kevin Graham
_Emeritus
Posts: 13037
Joined: Fri Oct 27, 2006 6:44 pm

Re: Droopy's Myths Debunked

Post by _Kevin Graham »

Back to Droopy's myth #2:

"Government revenue nearly doubled during the Reagan years in the eighties, for precisely this reason, dwarfing revenues under the Carter administration where rates were much higher."

Let's take a closer look at Droopy's claims.

Image

Seems clear to me that the increase was gradual and quite constant for quite some time, so there was nothing particularly special about the Reagan years. It makes you wonder where Droopy is getting his information. The fact is all the evidence goes against everything Droopy is saying. But Droopy doesn't accept evidence unless it comes from one of his favorite think tanks.

Image
_Kevin Graham
_Emeritus
Posts: 13037
Joined: Fri Oct 27, 2006 6:44 pm

Re: Droopy's Myths Debunked

Post by _Kevin Graham »

Myth 1: Tax cuts “pay for themselves.”

“You cut taxes and the tax revenues increase.” — President Bush, February 8, 2006

“You have to pay for these tax cuts twice under these pay-go rules if you apply them, because these tax cuts pay for themselves.” — Senator Judd Gregg, then Chair of the Senate Budget Committee, March 9, 2006

Reality: A study by the President’s own Treasury Department confirmed the common-sense view shared by economists across the political spectrum: cutting taxes decreases revenues.

Proponents of tax cuts often claim that “dynamic scoring” — that is, considering tax cuts’ economic effects when calculating their costs — would substantially lower the estimated cost of tax reductions, or even shrink it to zero. The argument is that tax cuts dramatically boost economic growth, which in turn boosts revenues by enough to offset the revenue loss from the tax cuts.

But when Treasury Department staff simulated the economic effects of extending the President’s tax cuts, they found that, at best, the tax cuts would have modest positive effects on the economy; these economic gains would pay for at most 10 percent of the tax cuts’ total cost. Under other assumptions, Treasury found that the tax cuts could slightly decrease long-run economic growth, in which case they would cost modestly more than otherwise expected. (http://www.cbpp.org/7-27-06tax.htm)

The claim that tax cuts pay for themselves also is contradicted by the historical record. In 1981, Congress substantially lowered marginal income-tax rates on the well off, while in 1990 and 1993, Congress raised marginal rates on the well off. The economy grew at virtually the same rate in the 1990s as in the 1980s (adjusted for inflation and population growth), but revenues grew about twice as fast in the 1990s, when tax rates were increased, as in the 1980s, when tax rates were cut. Similarly, since the 2001 tax cuts, the economy has grown at about the same pace as during the equivalent period of the 1990s business cycle, but revenues have grown far more slowly. (http://www.cbpp.org/3-8-06tax.htm)

Some argue that, even if most tax cuts do not pay for themselves, capital gains tax cuts do. But, in reality, capital gains tax cuts cost money as well. After reviewing numerous studies of how investors respond to capital gains tax cuts, the Congressional Budget Office concluded that “the best estimates of taxpayers’ response to changes in the capital gains rate do not suggest a large revenue increase from additional realizations of capital gains — and certainly not an increase large enough to offset the losses from a lower rate.” That’s why CBO, the Joint Committee on Taxation, and the White House Office of Management and Budget all project that making the 2003 capital gains tax cut permanent would cost about $100 billion over the next ten years. (http://www.cbpp.org/policy-points4-18-08.htm)


So when Droopy says his argument is backed up by "tax history," apparently his history ignores the last thirty years.
_Droopy
_Emeritus
Posts: 9826
Joined: Mon May 12, 2008 4:06 pm

Re: Droopy's Myths Debunked

Post by _Droopy »

Shall I be impressed by Graham's cherry picked charts and graphs, for which he has no idea regarding the methodology used to construct them or what they are actually measuring?

No, Graham's attempt to rewrite the clear, well understood empirical economic history of the nation fails 3rd grade economics, as does his understanding of basic economics per se, which is far too clouded by his raging class envy and the hosanna's he wishes to shout regarding the God, savior and redeemer he worships, the state.

Do you think Graham has actaully read the Laffer essay I linked to? Wrong. No, he's scanned it at a surface level to find isolated fragaments of it he can extract and use in an attempt to make the argument he can't make himself rationally on his own intellectual steam.

As poorly read as Graham is, and as animated by the need to self justify his global revolt against all light and truth, from what ever quarter it may be found, whether it be spiritual, political, or economic, all he can do is collate cherry picked graphs of unknown methodological provenance and call names.

That's all he has.

Meanwhile, he's hoping readers of his rants will not themselves actually read Laffer's essay, preferring to rely on his own interpretation. That would be a major mistake, as his interpretation of Laffer is so grossly mendacious as to give one pause that Graham is really even approaching any aspect of the argument in any semblance of good faith.

He has also grossly misrepresented my own argument here, by claiming repeatedly that I've claimed that all tax cuts whatever increase government revenue. Of course, I've never made that claim, but only Laffer's and other free market economists who actually understand how tax policy effect human behavior.

So let's take an actual look at what Laffer is saying, not what Comrade Graham want's you to think it says.

The Laffer Curve: Past, Present, and Future
Published on June 1, 2004 by Arthur Laffer Backgrounder #1765


The Historical Origins of the Laffer Curve

The Laffer Curve, by the way, was not invented by me. For example, Ibn Khaldun, a 14th century Muslim philosopher, wrote in his work The Muqaddimah: "It should be known that at the beginning of the dynasty, taxation yields a large revenue from small assessments. At the end of the dynasty, taxation yields a small revenue from large assessments."

A more recent version (of incredible clarity) was written by John Maynard Keynes:

When, on the contrary, I show, a little elaborately, as in the ensuing chapter, that to create wealth will increase the national income and that a large proportion of any increase in the national income will accrue to an Exchequer, amongst whose largest outgoings is the payment of incomes to those who are unemployed and whose receipts are a proportion of the incomes of those who are occupied...

Nor should the argument seem strange that taxation may be so high as to defeat its object, and that, given sufficient time to gather the fruits, a reduction of taxation will run a better chance than an increase of balancing the budget. For to take the opposite view today is to resemble a manufacturer who, running at a loss, decides to raise his price, and when his declining sales increase the loss, wrapping himself in the rectitude of plain arithmetic, decides that prudence requires him to raise the price still more--and who, when at last his account is balanced with nought on both sides, is still found righteously declaring that it would have been the act of a gambler to reduce the price when you were already making a loss.

Theory Basics


The basic idea behind the relationship between tax rates and tax revenues is that changes in tax rates have two effects on revenues: the arithmetic effect and the economic effect. The arithmetic effect is simply that if tax rates are lowered, tax revenues (per dollar of tax base) will be lowered by the amount of the decrease in the rate. The reverse is true for an increase in tax rates. The economic effect, however, recognizes the positive impact that lower tax rates have on work, output, and employment--and thereby the tax base--by providing incentives to increase these activities. Raising tax rates has the opposite economic effect by penalizing participation in the taxed activities. The arithmetic effect always works in the opposite direction from the economic effect. Therefore, when the economic and the arithmetic effects of tax-rate changes are combined, the consequences of the change in tax rates on total tax revenues are no longer quite so obvious.

Figure 1 is a graphic illustration of the concept of the Laffer Curve--not the exact levels of taxation corresponding to specific levels of revenues. At a tax rate of 0 percent, the government would collect no tax revenues, no matter how large the tax base. Likewise, at a tax rate of 100 percent, the government would also collect no tax revenues because no one would willingly work for an after-tax wage of zero (i.e., there would be no tax base). Between these two extremes there are two tax rates that will collect the same amount of revenue: a high tax rate on a small tax base and a low tax rate on a large tax base.

Image


The Laffer Curve

The Laffer Curve itself does not say whether a tax cut will raise or lower revenues. Revenue responses to a tax rate change will depend upon the tax system in place, the time period being considered, the ease of movement into underground activities, the level of tax rates already in place, the prevalence of legal and accounting-driven tax loopholes, and the proclivities of the productive factors. If the existing tax rate is too high--in the "prohibitive range" shown above--then a tax-rate cut would result in increased tax revenues. The economic effect of the tax cut would outweigh the arithmetic effect of the tax cut.


The above is the carefully cherry picked paragraph Graham used in his attempt to show that the essay here does not actually say what I've argued it says, and that I don't understand it. But as we keep reading...
Moving from total tax revenues to budgets, there is one expenditure effect in addition to the two effects that tax-rate changes have on revenues. Because tax cuts create an incentive to increase output, employment, and production, they also help balance the budget by reducing means-tested government expenditures. A faster-growing economy means lower unemployment and higher incomes, resulting in reduced unemployment benefits and other social welfare programs.

Over the past 100 years, there have been three major periods of tax-rate cuts in the U.S.: the Harding-Coolidge cuts of the mid-1920s; the Kennedy cuts of the mid-1960s; and the Reagan cuts of the early 1980s. Each of these periods of tax cuts was remarkably successful as measured by virtually any public policy metric.

Prior to discussing and measuring these three major periods of U.S. tax cuts, three critical points should be made regarding the size, timing, and location of tax cuts.

Size of Tax Cuts


People do not work, consume, or invest to pay taxes. They work and invest to earn after-tax income, and they consume to get the best buys after tax. Therefore, people are not concerned per se with taxes, but with after-tax results. Taxes and after-tax results are very similar, but have crucial differences.

Using the Kennedy tax cuts of the mid-1960s as our example, it is easy to show that identical percentage tax cuts, when and where tax rates are high, are far larger than when and where tax rates are low. When President John F. Kennedy took office in 1961, the highest federal marginal tax rate was 91 percent and the lowest was 20 percent. By earning $1.00 pretax, the highest-bracket income earner would receive $0.09 after tax (the incentive), while the lowest-bracket income earner would receive $0.80 after tax. These after-tax earnings were the relative after-tax incentives to earn the same amount ($1.00) pretax.

By 1965, after the Kennedy tax cuts were fully effective, the highest federal marginal tax rate had been lowered to 70 percent (a drop of 23 percent--or 21 percentage points on a base of 91 percent) and the lowest tax rate was dropped to 14 percent (30 percent lower). Thus, by earning $1.00 pretax, a person in the highest tax bracket would receive $0.30 after tax, or a 233 percent increase from the $0.09 after-tax earned when the tax rate was 91 percent. A person in the lowest tax bracket would receive $0.86 after tax or a 7.5 percent increase from the $0.80 earned when the tax rate was 20 percent.

Putting this all together, the increase in incentives in the highest tax bracket was a whopping 233 percent for a 23 percent cut in tax rates (a ten-to-one benefit/cost ratio) while the increase in incentives in the lowest tax bracket was a mere 7.5 percent for a 30 percent cut in rates--a one-to-four benefit/cost ratio. The lessons here are simple: The higher tax rates are, the greater will be the economic (supply-side) impact of a given percentage reduction in tax rates. Likewise, under a progressive tax structure, an equal across-the-board percentage reduction in tax rates should have its greatest impact in the highest tax bracket and its least impact in the lowest tax bracket.

Timing of Tax Cuts

The second, and equally important, concept of tax cuts concerns the timing of those cuts. In their quest to earn after-tax income, people can change not only how much they work, but when they work, when they invest, and when they spend. Lower expected tax rates in the future will reduce taxable economic activity in the present as people try to shift activity out of the relatively higher-taxed present into the relatively lower-taxed future. People tend not to shop at a store a week before that store has its well-advertised discount sale. Likewise, in the periods before legislated tax cuts take effect, people will defer income and then realize that income when tax rates have fallen to their fullest extent. It has always amazed me how tax cuts do not work until they actually take effect.

When assessing the impact of tax legislation, it is imperative to start the measurement of the tax-cut period after all the tax cuts have been put into effect. As will be obvious when we look at the three major tax-cut periods--and even more so when we look at capital gains tax cuts--timing is essential.

Location of Tax Cuts


As a final point, people can also choose where they earn their after-tax income, where they invest their money, and where they spend their money. Regional and country differences in various tax rates matter.

The Harding-Coolidge Tax Cuts

In 1913, the federal progressive income tax was put into place with a top marginal rate of 7 percent. Thanks in part to World War I, this tax rate was quickly increased significantly and peaked at 77 percent in 1918. Then, through a series of tax-rate reductions, the Harding-Coolidge tax cuts dropped the top personal marginal income tax rate to 25 percent in 1925. (See Figure 2.)

Image

The Top Marginal Personal Income Tax Rate, 1913-2003

Although tax collection data for the National Income and Product Accounts (from the U.S. Bureau of Economic Analysis) do not exist for the 1920s, we do have total federal receipts from the U.S. budget tables. During the four years prior to 1925 (the year that the tax cut was fully implemented), inflation-adjusted revenues declined by an average of 9.2 percent per year (See Table 1). Over the four years following the tax-rate cuts, revenues remained volatile but averaged an inflation-adjusted gain of 0.1 percent per year. The economy responded strongly to the tax cuts, with output nearly doubling and unemployment falling sharply.


In the 1920s, tax rates on the highest-income brackets were reduced the most, which is exactly what economic theory suggests should be done to spur the economy.

Furthermore, those income classes with lower tax rates were not left out in the cold: The Harding-Coolidge tax-rate cuts reduced effective tax rates on lower-income brackets. Internal Revenue Service data show that the dramatic tax cuts of the 1920s resulted in an increase in the share of total income taxes paid by those making more than $100,000 per year from 29.9 percent in 1920 to 62.2 percent in 1929 (See Table 2). This increase is particularly significant given that the 1920s was a decade of falling prices, and therefore a $100,000 threshold in 1929 corresponds to a higher real income threshold than $100,000 did in 1920. The consumer price index fell a combined 14.5 percent from 1920 to 1929. In this case, the effects of bracket creep that existed prior to the federal income tax brackets being indexed for inflation (in 1985) worked in the opposite direction.

Image

Perhaps most illustrative of the power of the Harding-Coolidge tax cuts was the increase in gross domestic product (GDP), the fall in unemployment, and the improvement in the average American's quality of life during this decade. Table 3 demonstrates the remarkable increase in American quality of life as reflected by the percentage of Americans owning items in 1930 that previously had only been owned by the wealthy (or by no one at all).


Image


The Kennedy Tax Cuts


During the Depression and World War II, the top marginal income tax rate rose steadily, peaking at an incredible 94 percent in 1944 and 1945. The rate remained above 90 percent well into President John F. Kennedy's term. Kennedy's fiscal policy stance made it clear that he believed in pro-growth, supply-side tax measures:

Tax reduction thus sets off a process that can bring gains for everyone, gains won by marshalling resources that would otherwise stand idle--workers without jobs and farm and factory capacity without markets. Yet many taxpayers seemed prepared to deny the nation the fruits of tax reduction because they question the financial soundness of reducing taxes when the federal budget is already in deficit. Let me make clear why, in today's economy, fiscal prudence and responsibility call for tax reduction even if it temporarily enlarged the federal deficit--why reducing taxes is the best way open to us to increase revenues.3

Kennedy reiterated his beliefs in his Tax Message to Congress on January 24, 1963:

In short, this tax program will increase our wealth far more than it increases our public debt. The actual burden of that debt--as measured in relation to our total output--will decline. To continue to increase our debt as a result of inadequate earnings is a sign of weakness. But to borrow prudently in order to invest in a tax revision that will greatly increase our earning power can be a source of strength.

President Kennedy proposed massive tax-rate reductions, which were passed by Congress and became law after he was assassinated. The 1964 tax cut reduced the top marginal personal income tax rate from 91 percent to 70 percent by 1965. The cut reduced lower-bracket rates as well. In the four years prior to the 1965 tax-rate cuts, federal government income tax revenue--adjusted for inflation--increased at an average annual rate of 2.1 percent, while total government income tax revenue (federal plus state and local) increased by 2.6 percent per year (See Table 4). In the four years following the tax cut, federal government income tax revenue increased by 8.6 percent annually and total government income tax revenue increased by 9.0 percent annually. Government income tax revenue not only increased in the years following the tax cut, it increased at a much faster rate.

Image

The Kennedy tax cut set the example that President Ronald Reagan would follow some 17 years later. By increasing incentives to work, produce, and invest, real GDP growth increased in the years following the tax cuts: More people worked, and the tax base expanded. Additionally, the expenditure side of the budget benefited as well because the unemployment rate was significantly reduced.

Using the Congressional Budget Office's revenue forecasts (made with the full knowledge of the future tax cuts), revenues came in much higher than had been anticipated, even after the "cost" of the tax cut had been taken into account (See Table 5).

Image

Additionally, in 1965--one year following the tax cut--personal income tax revenue data exceeded expectations by the greatest amounts in the highest income classes (See Table 6).

Testifying before Congress in 1977, Walter Heller, President Kennedy's Chairman of the Council of Economic Advisers, summarized:

What happened to the tax cut in 1965 is difficult to pin down, but insofar as we are able to isolate it, it did seem to have a tremendously stimulative effect, a multiplied effect on the economy. It was the major factor that led to our running a $3 billion surplus by the middle of 1965 before escalation in Vietnam struck us. It was a $12 billion tax cut, which would be about $33 or $34 billion in today's terms, and within one year the revenues into the Federal Treasury were already above what they had been before the tax cut.

Did the tax cut pay for itself in increased revenues? I think the evidence is very strong that it did.


The Reagan Tax Cuts


In August 1981, President Reagan signed into law the Economic Recovery Tax Act (ERTA, also known as the Kemp-Roth Tax Cut). The ERTA slashed marginal earned income tax rates by 25 percent across the board over a three-year period. The highest marginal tax rate on unearned income dropped to 50 percent from 70 percent (as a result of the Broadhead Amendment), and the tax rate on capital gains also fell immediately from 28 percent to 20 percent. Five percentage points of the 25 percent cut went into effect on October 1, 1981. An additional 10 percentage points of the cut then went into effect on July 1, 1982. The final 10 percentage points of the cut began on July 1, 1983.

Looking at the cumulative effects of the ERTA in terms of tax (calendar) years, the tax cut reduced tax rates by 1.25 percent through the entirety of 1981, 10 percent through 1982, 20 percent through 1983, and the full 25 percent through 1984.

A provision of ERTA also ensured that tax brackets were indexed for inflation beginning in 1985.

To properly discern the effects of the tax-rate cuts on the economy, I use the starting date of January 1, 1983--when the bulk of the cuts were already in place. However, a case could be made for a starting date of January 1, 1984--when the full cut was in effect.

These across-the-board marginal tax-rate cuts resulted in higher incentives to work, produce, and invest, and the economy responded (See Table 7). Between 1978 and 1982, the economy grew at a 0.9 percent annual rate in real terms, but from 1983 to 1986 this annual growth rate increased to 4.8 percent.


Image

Prior to the tax cut, the economy was choking on high inflation, high Interest rates, and high unemployment. All three of these economic bellwethers dropped sharply after the tax cuts. The unemployment rate, which peaked at 9.7 percent in 1982, began a steady decline, reaching 7.0 percent by 1986 and 5.3 percent when Reagan left office in January 1989.

Inflation-adjusted revenue growth dramatically improved. Over the four years prior to 1983, federal income tax revenue declined at an average rate of 2.8 percent per year, and total government income tax revenue declined at an annual rate of 2.6 percent. Between 1983 and 1986, federal income tax revenue increased by 2.7 percent annually, and total government income tax revenue increased by 3.5 percent annually.

The most controversial portion of Reagan's tax revolution was reducing the highest marginal income tax rate from 70 percent (when he took office in 1981) to 28 percent in 1988. However, Internal Revenue Service data reveal that tax collections from the wealthy, as measured by personal income taxes paid by top percentile earners, increased between 1980 and 1988--despite significantly lower tax rates (See Table 8).

Image

The Laffer Curve and the Capital Gains Tax

Changes in the capital gains maximum tax rate provide a unique opportunity to study the effects of taxation on taxpayer behavior. Taxation of capital gains is different from taxation of most other sources of income because people have more control over the timing of the realization of capital gains (i.e., when the gains are actually taxed).

The historical data on changes in the capital gains tax rate show an incredibly consistent pattern. Just after a capital gains tax-rate cut, there is a surge in revenues: Just after a capital gains tax-rate increase, revenues take a dive. As would also be expected, just before a capital gains tax-rate cut there is a sharp decline in revenues: Just before a tax-rate increase there is an increase in revenues. Timing really does matter.

This all makes total sense. If an investor could choose when to realize capital gains for tax purposes, the investor would clearly realize capital gains before tax rates are raised. No one wants to pay higher taxes.

In the 1960s and 1970s, capital gains tax receipts averaged around 0.4 percent of GDP, with a nice surge in the mid-1960s following President Kennedy's tax cuts and another surge in 1978-1979 after the Steiger-Hansen capital gains tax-cut legislation went into effect (See Figure 3).

Image

Following the 1981 capital gains cut from 28 percent to 20 percent, capital gains revenues leapt from $12.5 billion in 1980 to $18.7 billion by 1983--a 50 percent increase--and rose to approximately 0.6 percent of GDP. Reducing income and capital gains tax rates in 1981 helped to launch what we now appreciate as the greatest and longest period of wealth creation in world history. In 1981, the stock market bottomed out at about 1,000--compared to nearly 10,000 today...


Image

This next portion is indicative of the way in which Kevin skims arguments and texts for isolated portions he can use to create clever arguments in opposition to what a text is actually saying in order to score debating points, while hoping readers do not actually do their own homework:

As expected, increasing the capital gains tax rate from 20 percent to 28 percent in 1986 led to a surge in revenues prior to the increase ($328 billion in 1986) and a collapse in revenues after the increase took effect ($112 billion in 1991).


In other words, and as with other kinds of taxes, rate increases lead to an initial spike in government tax receipts as investors and entrepreneurs rush to realize as much capital gain as possible before the rates take effect. Once they do take effect, however, economic activity falls, the tax base shrinks, and revenue falls.

Simply, logical, rudimentary political economy.

Reducing the capital gains tax rate from 28 percent back to 20 percent in 1997 was an unqualified success, and every claim made by the critics was wrong. The tax cut, which went into effect in May 1997, increased asset values and contributed to the largest gain in productivity and private sector capital investment in a decade. It did not lose revenue for the federal Treasury.

In 1996, the year before the tax rate cut and the last year with the 28 percent rate, total taxes paid on assets sold was $66.4 billion (Table 9). A year later, tax receipts jumped to $79.3 billion, and in 1998, they jumped again to $89.1 billion. The capital gains tax-rate reduction played a big part in the 91 percent increase in tax receipts collected from capital gains between 1996 and 2000--a percentage far greater than even the most ardent supply-siders expected.

Image

Seldom in economics does real life conform so conveniently to theory as this capital gains example does to the Laffer Curve. Lower tax rates change people's economic behavior and stimulate economic growth, which can create more--not less--tax revenues.


In sum, Kevin has no conception of how free market economics actually work, the nature of microeconomic phenomena, or the basic dynamics of "catallactics" that determine the nature and extent of incentives to work, save, invest, and produce, or not to. As one can also easily discern from the statistical data referenced in this paper, there are either distinct methodological differences in the graphs Kevin is using, or equally distinct interpretational flaws that are internal of Kevin himself.

Interesting it is, how in such a short time Keven went from a faithful member of the Church to a bitter, bigoted apostate, and then from a staunch conservative to an equally bitter and intellectually fragile leftist and apologetic shill for statism, riddled and pockmarked with class envy and hostility to individual liberty.
Last edited by Guest on Mon Dec 20, 2010 8:28 pm, edited 1 time in total.
Nothing is going to startle us more when we pass through the veil to the other side than to realize how well we know our Father [in Heaven] and how familiar his face is to us

- President Ezra Taft Benson


I am so old that I can remember when most of the people promoting race hate were white.

- Thomas Sowell
_Droopy
_Emeritus
Posts: 9826
Joined: Mon May 12, 2008 4:06 pm

Re: Droopy's Myths Debunked

Post by _Droopy »

Droopy, I am merely informing you of the facts, and the facts are that the majority of tax scholars think that the mystical powers attributed to the Laffer Curve by conservatives are laughable. Because, in fact, a tax cut's boost to the economy is fairly limited. If you don't like the facts, then you are clearly just an ideologue with an agenda.


CFR regarding the "majority of tax scholars" claim.

The empirical facts of the matter are in contradiction to your claim above. Boosts to the economy, depending upon the degree to which rates are reduced, the marginal rates they are reduced from, and their timing, can be dramatic.

You and Kevin may retreat further and further from the real world into your tiny little crib-like cubicle of leftist ideological nostrums and pious etatist fantasies of your own moral and intellectual self importance, but those of us still connected to the real world will continue to rely on the disciplines of critical thought and the empirical facts of experience to guide us, as well as, even more importantly, a reverence for the truth, which is everywhere and always the first and most troubling casualty of the cowardly retreat from the challenges of the mortal condition into leftism.

What is it that I exactly need to argue, when what I am doing is telling you what I know about the consensus of tax academics? I will say that the statistics appear to bear out their argument, whether you like it or not. Too bad for you, Droopy.


The "consensus" argument from authority has developed a very bad reputation Kish, and even if you can demonstrate this claim empirically, the majority opinion of academics in social sciences like economics within which data can be manipulated to a far greater extent than in the natural sciences (where we know it can be manipulated to a startling degree) are no more definitive than they've ever been.

Keynesian demand side monetary theory has been empirically and theoretically discredited almost since its inception (by Von Mises and other distinguished free market thinkers, like Henry Hazlett) and yet survived its delegitimization to deeply influence economic policy through the sixties and seventies and on into the present (the inane "stimulus" ideas of the Obama administration ).

Consensus isn't going to cut it. Adduce some serious, balanced, rational, critical arguments, or hit the road.
Nothing is going to startle us more when we pass through the veil to the other side than to realize how well we know our Father [in Heaven] and how familiar his face is to us

- President Ezra Taft Benson


I am so old that I can remember when most of the people promoting race hate were white.

- Thomas Sowell
_Droopy
_Emeritus
Posts: 9826
Joined: Mon May 12, 2008 4:06 pm

Re: Droopy's Myths Debunked

Post by _Droopy »

There is no possible place to start with Kevin's dog and pony show here. There is far too much to debunk, and the ease of doing so is too light to make it really much of a challenge.

I can pick any one of the pellets Graham has shot from his scattergun in this thread and easily and surgically dismantle it, but spending an entire day arguing with a juvenile version of Chris Matthews is not my cup of tea. I have far better things to do.

The really important thing here is to demonstrate, through a little logical argument and the pointing out of some simple, basic facts, the degree to which Graham carefully and at only a surface level, cherry picks the data and claims he uses while ignoring salient variables and complexities that would monkey wrench his arguments.

Let's take his claims about the Bush tax cuts, just for one example.

In the first place, the Wall Street Journal is not a "right wing" paper; only its editorial section is conservative. But this is only the beginning of a plethora of errors and mistakes Graham makes because he's really not interested in understanding what he's talking about, just winning an internet debate with a "right winger".

Firstly, the total new jobs created between the Budget Reconciliation Act of 1993 and the end of Clinton's term was actually 21.4 million, not 23 million. Secondly, as there is no reason to believe, historically or as a matter of substantive economic theory, that increases in tax rates create greater economic activity (indeed, this is counter-intuitive on its face), other factors present during the Clinton years must come into play as causal factors in the growing economy at that time, including the 1997 tax cuts, which most certainly stimulated the economy and perhaps softened the negative effects of Clinton's substantial tax increases, negating economic weakness that did not materialize because of the stimulative effects of those tax deceases.

Thirdly, Welfare reform, lower government spending as a share of gross domestic product, the highly successful NAFTA, and other variables combined with the stimulative effect of lowering
taxes on productive economic activity were probably the main wellsprings of the healthy economy in Clinton's second term, not tax hikes, which decease productive economic activity, discourage investment and job creation, and shrink the total tax base.

Did the Bush tax cuts decrease revenue? Certainly:

Image

But notice, this was only during the period in which the tax cuts were being phased in. Revenues fall until 2003, and then take off again dramatically. What do graphs like this, of which Kevin is so fond and which he tends to use in lieu of critical argument, actually show us?

Not much beyond correlation, which is why one must have a broad understanding of a number of variables involved in any such analysis as well as a substantive theoretical background from which to interpret statistical graphs such as this, which are after all, human methodological constructions that only capture a limited and compartmentalized snapshot of much more complex phenomena.

Did the Bush tax hikes decease or raise revenue? Well, what a graph like this one tells us is that revenues deceased as the tax cuts were phased in, and then took of after full implementation. But is this lag in revenue increase fully a product of the tax cuts? Kevin ignores confounding variables such as the major recession under way between 2000 and 2003, fueled by the dot com collapse and 9/11.

Its simple to understand that evenue rises as GDP goes up, as population rises and more people enter the workforce, and as people live and work longer. This explains Graham's disingenuous statistical analysis through which he attempts to show that revenue has continually risen over decades while through both high and low tax periods:

Image

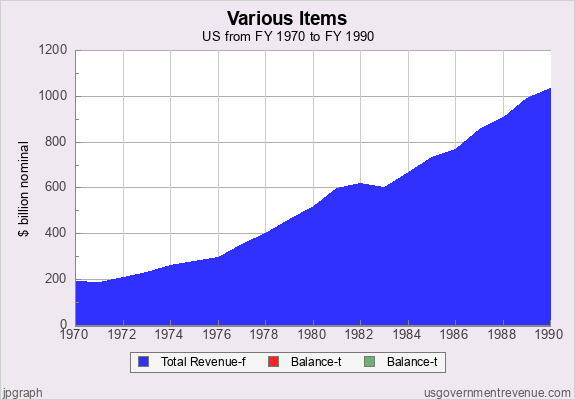
Note that Graham has just provided, unwittingly perhaps, the very evidence against his own argument that Laffer and other free market economists would point to as evidence of their claims. Look at the graph. At the end of the Nixon and Carter years (both liberal, interventionist Keynesians given to high taxes, deep government regulation, and price controlling), government revenue was well under half of what it was after the seven year supply side boom of the eighties.

Again, Graham has two fundamental problems here, the first being that he simply does not understand basic free market economics, and the second being his disdain and rejection the disciplines of critical thinking in his quest for a quick ideological/psychological fix.

Tax revenues are not correlated with tax rates but with economic growth. That's the fundamental theoretical and historical principle involved. This is why leftists like Graham, who's primary purpose is not to understand economics but to offer sacrifices to their god, government, continue to make illogical and counter-intuitive claims that rising tax burdens, and even substantial ones, increase government revenue.

That's simply a plea for the static, interested political class/statist position that Laffer has termed the "arithmetical". What actually occurs, however, is an economic effect, a "catallactic" effect based upon rational human being's perception of and reaction to economic incentives and environments. Increasing tax rates would increase government revenue - in an econometric mathematical model or in a formal deductive argument. In the real world, however, devoid of the need for ideological purity and emotional venting at personal mythological enemies, human behavior changes; economic activity recedes, the tax base shrinks, and government revenues wilt.

Image

Note also in Graham's graph the big dip just at the 1982 to 1983 mark; that's the second major Carter-Keynesian recession coming out of the 70s, while the economy was hemorrhaging jobs and capital and the Reagan tax cuts were in their phase in stage. Then notice in 1984, when the tax cuts become fully active, the economy does what? Yes, it takes off, and takes off dramatically. By 1990, government revenue comes in at just over a trillion dollars, as compared to the roughly $500 billion that ended the economically disastrous Carter years, which themselves were simply more dramatic extensions of Nixon's policies.

If I give Kevin enough rope...well, you know.

Now, let's discuss Kevin's quaint Michael Mooresque leftist class war fables about the Bush tax cuts. What is the truth here?

Well, in the first place, let's revisit the claim that the Bush tax cuts reduced revenue and increased the deficit. Kevin can use his carefully selected graphs to show correlations between the Bush tax cuts and revenue decreases. Did they decrease? Yes, they did, as the cuts were being phased in over several years. Were the cuts the cause of the revenue decreases. In the interim, perhaps (and there is nothing wrong with deceased government revenues, by the way), but tax revenues in 2006 were actually higher than the projected levels that existed before the 2003 cuts ($47 billion above the projection)

What were the projections for revenue? Well, the CBO had predicted that the 2003 cuts would lower revenue by some $75 billion (and this is the product of the long discredited - but politically useful "static" scoring method used by such government agencies, which makes no attempt to capture actual changes in economic behavior generated by government policy). What actually happened? 2006 revenues were $47 billion above the pre-tax cut assumptions.

The Bush cuts appear to have actually recovered lost revenue and stimulated the economy (not self negating, debt creating and wealth destroying Keynesian "stimulus" , but the actual stimulating of private sector wealth creation through the stimulation of risk, investment and entrepreneurship - work).

Were the Bush tax cuts good for the economy, or a detriment? As usual, Red Kevin Graham is wrong yet again:

Image

What taxes were lowered in the Bush cuts? Income, dividend, and capital gains taxes. In other words, these tax cuts were aimed primarily at the job and opportunity creating elements of society, the purpose of which was to incentivize work, savings, investment, and risk - wealth creation. What happened? Look at the empirical evidence above.

Wherever you look, Kevin's claims appear to be on life support. Non-residential fixed investment was in decline for 13 consecutive quarters before the Bush cuts. What the happened after their full phasing in? Thirteen consecutive quarters of expansion is what happened, along with a boom in the S&P and increases in dividend payments.

But please don't get the idea that because of the primary targets of the tax cuts, this was a "tax cut for the wealthy" the poor, hoary, wheelchair-bound class warfare shibboleth of the Ruling Class that has kept so many demagogues in power for so long at the expense of so many.

Actually, following a dramatic trend that began under Reagan, the rich are now paying the vast majority of all income taxes paid, as they paid in ever rising percentages from Reagan through the present time. Did the millionaire save more for a 1% cut in taxes than the guy making $25,000 a year? Of course, because those low income household pay almost nothing in income taxes, while the millionaire paid much more into the system to begin with.

Despite Graham's populist class warfare mythology, the Bush tax cuts shifted even more of the tax burden toward the wealthy, following a a consistent trend over several decades. good heavens, by the year 2000, the top 60% of American taxpayers were shouldering virtually 100% of all income taxes paid. Meanwhile the bottom 40% paid no income taxes at all. How then, one might want to ask economics expert and moral philosopher Kevin Graham, could politicians give takes breaks to people who...pay no taxes.

Well, Obama has done just that (the now infamous Obama "tax cuts" that are actually tax "credits" that will actually provide "tax cuts" (government checks) to some 44 million Americans who pay no income tax at all), but giving a tax cut to those who pay no taxes is not a tax cut, but a welfare payment - a government income transfer, not a tax cut.

This is actually a very disturbing development for a constitutional republic and a free society, as a society in which the vast majority pay no income taxes, but receive government largess and gratuities from the revenue of the tiny percentage who do, is a society that is creating a vast body of lower classes dependent upon government for much of their lot in life, funded my a tiny, productive minority of job creators.

As the ravenous appetite for more government "benefits" grows, and as the ability of the economy to sustain those benefits shrinks, the mentality of class warfare will move from smoldering ember to raging brush fire, and we will be living in a society in which a clear majority of citizens are dependent upon government for much of their position and security in life. A massive, perhaps overwhelming constituency that supports leviathan government, the nanny state, and an entrenched political class and which lives parasitically on the wealth created by the job and opportunity creating minority will have been created that has no further interest in the limited government, individual liberty, or the rule of law.

That will be the end of the republic as we know it and as the Founders created it.
Nothing is going to startle us more when we pass through the veil to the other side than to realize how well we know our Father [in Heaven] and how familiar his face is to us

- President Ezra Taft Benson


I am so old that I can remember when most of the people promoting race hate were white.

- Thomas Sowell
Post Reply